Glass Process Imaging System
Category: IR systems
Key features
- Improve profitability and product quality
- Reduce setup time and detect defects quickly
- Define product-specific configurations and data files
- Automate quality monitoring for ISO9000
- View complete thermal images and temperature profiles
- Customize and display zones overlaid on a thermal image
- Automatically analyze zone temperatures
Product overview
The GS150 Thermal Imaging System is an automated temperature measurement system for glass bending, forming, annealing and tempering processes. The GS150 measures a line of up to 1024 points using a rotating mirror that scans a 90º field-of-view up to 150 times per second. The scanning of a glass part is initiated by the measured temperature, or an external "trigger" signal. As each heated glass part traverses the field-of-view, a two-dimensional thermal image or "thermogram" is formed.
The GS150 installs easily, just like a camera, and views the glass part from above, whenever it has a clear path. Connecting the pre-wired cables (included) to a PC and entering installation dimensions in the GS150 Software completes the installation process.
GS150LE Thermal Imaging System
The GS150LE Thermal Imaging System for Low Emissivity (Low-E) Glass is specifically designed to monitor and optimize the tempering process of one-side coated flat glass, and is based on the proven Raytek GS150 system.
This system features an automatic emissivity correction mode which adjusts to changes between different glass loads. It allows the user to set up predefined recipes to accommodate frequent product changes.
By quickly detecting thermal irregularities within the glass and identifying defective heating elements, the GS150LE allows glass processors to improve product quality and uniformity, and reduce scrap.
Software
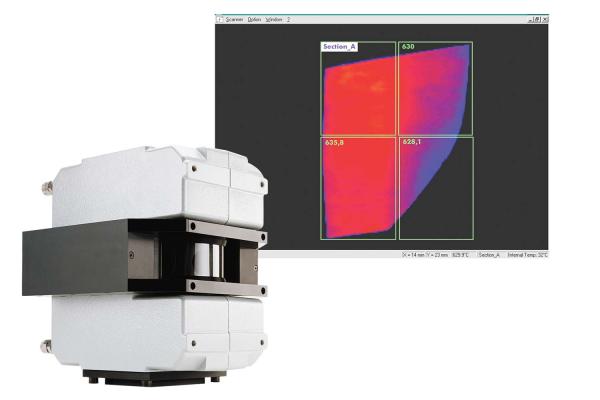
The GS150 Thermal Imaging System allows you to see what's happening in your glass process.
The grid overlay represents the heating element zones in the furnace. The average temperature of each zone is displayed in the corner. Zones are tailored to each application depending on heater size and location. Temperatures for each zone are displayed as average, maximum, or minimum values. Serial or analog outputs can be configured to provide outputs proportional to each zone's temperature.
Thermal image data files can be recalled for subsequent analysis and display. As the cursor is moved around the thermal image to selected locations, the spot temperature and location (x and y coordinates) appear on the Task Bar. Move the cursor to selected spots, and the software displays the corresponding temperature profiles that intersect that spot location in the machine-direction and cross machine-direction.